
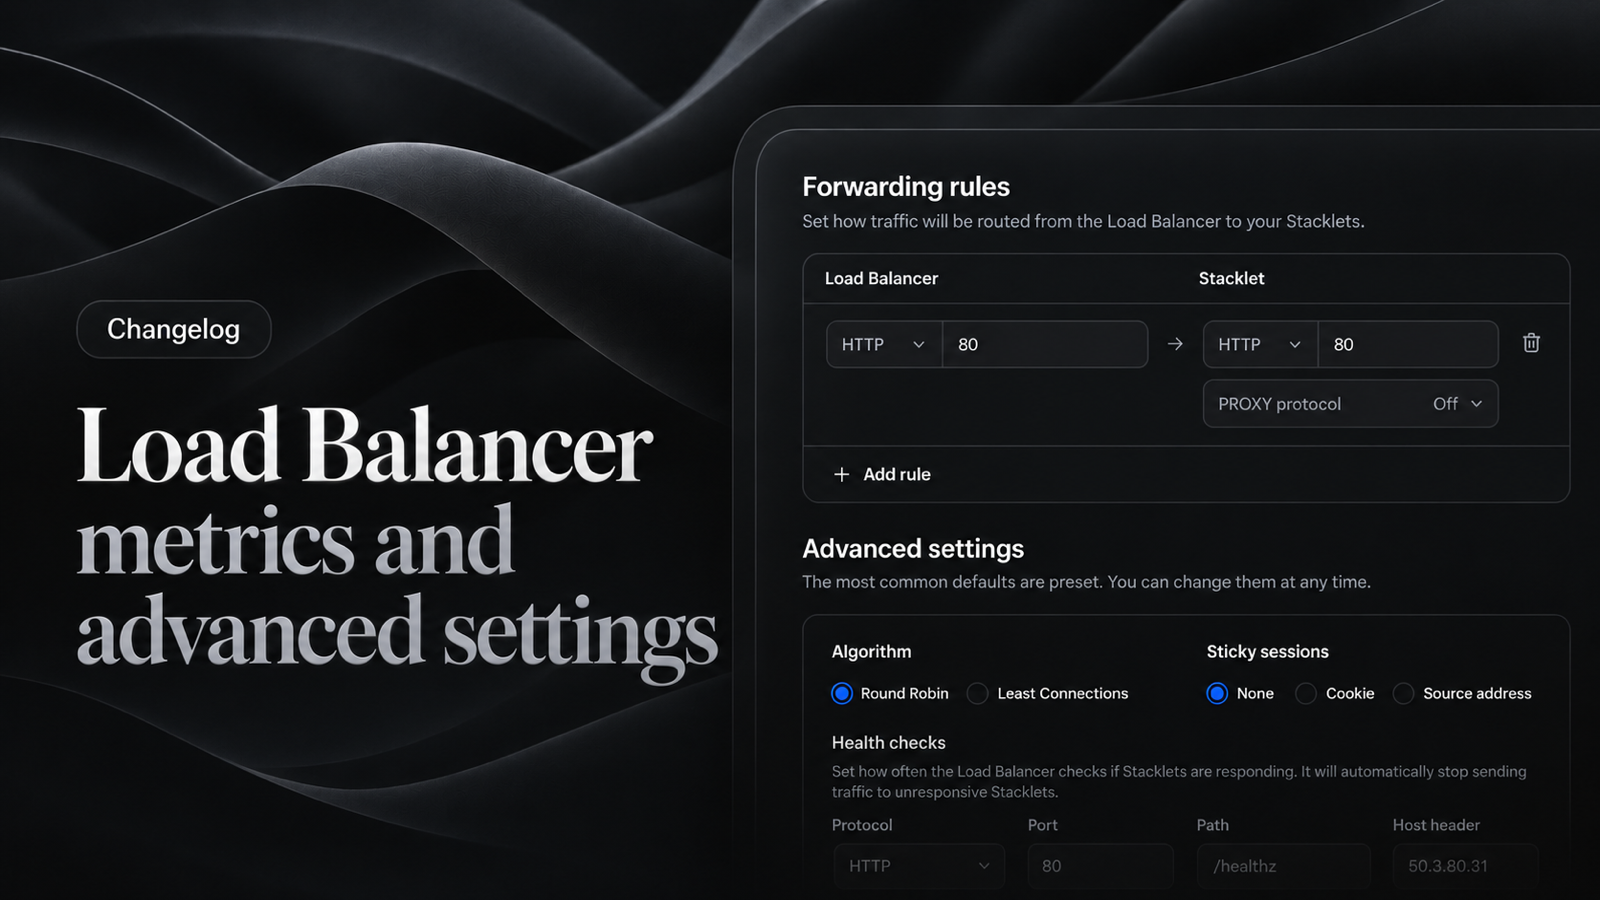
Load Balancer metrics and advanced settings
Load Balancers now have six metric charts and expose more of their configuration. Charts across the panel share one cleaner style.
New
Load Balancers — Six metric charts, grouped into graph sections.
Load Balancers — Configure target protocol, PROXY protocol, health check host and timeouts.
Load Balancers — Health checks are optional when creating a load balancer.
Improvements
Charts — Stacklet and Database graphs use the same chart style: thinner lines, a filled area for single-series charts, and no axis domain lines.
User Scripts — Added an illustration to the empty state.
Fixes
Teams — Data is refetched after switching teams, so you no longer see resources from the previous team.
Teams — Hardened team switching and session handling.
Load Balancers — Backend downtime now reflects the real state of Stacklets.
Load Balancers — Unified the up/down status badge and fixed a status skeleton that never finished loading.
Charts — Chart titles stay on one line.
Comments
No comments yet. Start the conversation.